United States – Google adds the latest update on Google Maps – a new COVID layer, which will enable users to view critical information about COVID-19 cases in an area, and therefore help them make more informed decisions about where to go and what to do amid the pandemic.
The new layer is the latest COVID-related layer on the app. Layer is the app’s staple management button to see maps in a categorized view, and since the pandemic struck, the tech giant has updated Google Maps with COVID-related layers such as COVID-19 alerts in transit and COVID checkpoints.

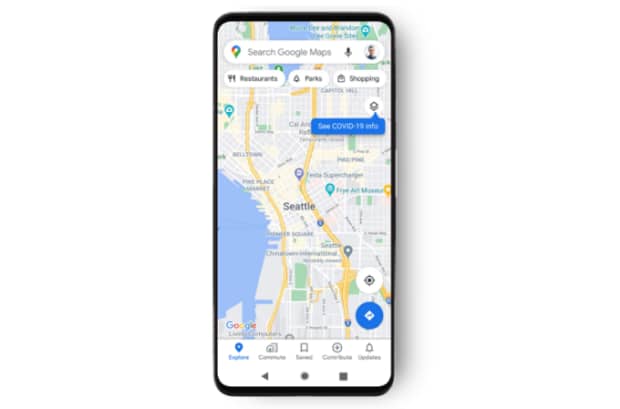
The layer is labelled “COVID-19 info.” When users click on it, they will be able to see a seven-day average of new COVID cases per 100,000 people for the area of the map they’re looking at, and they will also be able to see a label that indicates whether the cases are trending up or down, explained product manager Sujoy Banerjee in an update post.

By using the color coding feature, users will also be able to easily distinguish the density of new cases in an area. The trending case data will be visible at the country level for all 220 countries and territories that Google Maps supports, along with state or province, county, and city-level data where available.
According to Banerjee, data featured in the COVID layer comes from multiple authoritative sources, including Johns Hopkins, the New York Times, and Wikipedia. Google chose these sources as their data comes from public health organizations like the World Health Organization, government health ministries, along with state and local health agencies and hospitals. Many of these sources already power COVID case information in Google Search.
“While getting around is more complicated these days, our hope is that these Google Maps features will help you get where you need to be as safely and efficiently as possible,” said Banerjee.
The COVID layer starts rolling out worldwide on Android and iOS this week.